
Since the dawn of the WWE Network era wrestling metricians have been at a loss to get an idea of the economic value of individual WWE pay-per-views. Before the Network, WWE publicly reported buys for individual PPVs. With the launch of the Network that metric became muddled until finally this year WWE somewhat understandably quit providing PPV data altogether. Did this past Summerslam draw a lot of interest in WWE? Which B PPV this year was most successful? We don’t know. What about recent WrestleManias? How do they compare to the biggest WrestleManias of the PPV-only era?
In this article, I’ve used Google interest data to try to reconcile the loss of our ability to make “apples-to-apples” comparisons of WWE pay-per-views since the launch of the WWE Network -- and really any comparisons at all of PPVs after the Network launch.

Any hard viewership data for the Network isn’t released publicly. WWE only releases a quarterly update on its service’s subscribers, as well as its peak numbers the day after WrestleMania. The service itself lists a “Most Popular” section, which may or may not reflect real metrics.
Are there any metrics available we can use to predict how PPVs in the current era would’ve performed if they were still sold exclusively on traditional PPV? I’ve found Google interest is a good, if imperfect predictor.
Methodology
I collected actual PPV buys for WWE PPVs from 2006 to Elimination Chamber 2014 (the last WWE PPV before the Network launched) and compared them to the Google interest number for the week of each PPV. On average, Google interest predicted actual PPV buys within 3%. That’s a small enough margin that it’s reasonable to look at Google interest numbers for PPVs after the Network launched to get an idea of how each PPV would have performed on traditional PPV, and more importantly, how much interest the event generated for WWE.
Okay, but what is the Google interest metric? First, it’s important to note Google interest that can be researched publicly via Google Trends is a standardized value; Google doesn’t reveal any absolute quantities such as the raw number of searches associated with the data. When you look at the Google Trends of WWE for a given timeframe, you usually find the greatest interest around the week of a WrestleMania event, which, since interest was highest during a given period of time, will be given a value of 100, which all other weeks (or small denominations of time if you look at smaller segments of time) will be mathematically compared to. Most PPV weeks’ Google interest numbers are in the range of 50 to 70 compared to a WrestleMania.
Controlling for PPV types
Most PPVs don’t sell between 50% and 70% of the PPV buys a WrestleMania does. So to adjust for that, I broke PPVs down into five categories: WrestleMania, Royal Rumble, Summerslam, Survivor Series and B PPVs. Yes, I know Survivor Series hasn’t been an “A” PPV in many years and its PPV buys aren’t dramatically stronger than that of B PPVs, but Survivor Series did on average do better than the average B PPV (276,000 vs. 215,974). And unlike other B PPVs, it continued to be an annual tradition throughout the 2006 to present time period.
So I used these five separate categories to divide actual PPV buys by Google interest points and averaged them to make a prediction about how many PPV buys 1 point of Google interest would be worth. This is what I got:
WrestleMania: 1 point = 12,275 buys
Royal Rumble: 1 point = 7,784 buys
Summerslam: 1 point = 6,337 buys
Survivor Series: 1 point = 4,688 buys
B PPVs (all others): 1 point = 3,636 buys
Comparing actual PPV buys against Google interest points generates a correlation of 0.763, which indicates a strong relationship. A perfect relationship = 1.000. Admittedly when you break this down across the PPV type categories, the strength of the correlation varies.
Correlation: Google Interest & Actual PPV Buys
WrestleMania: 0.763
Royal Rumble: 0.414
Summerslam: 0.817
Survivor Series: 0.730
B PPV: 0.448
Overall: 0.763
Other factors to consider
One criticism of a study like this that might come to mind is that Google use has probably become more popular between 2006 and the present, and therefore more current data would have an advantage. However, the Help section for Google Trends states: “Each data point is divided by the total searches of the geography and time range it represents, to compare relative popularity.”
Notice that says “each data point” and not just each data set. To at least my reading, this is saying each individual data point (in our case, each week) is adjusted for the total number of searches during that time period (again in our case, each week), and therefore data shouldn’t be skewed by increases or decreases in the use of Google searches over time -- in our case, 2006 to present.
There was one outlying data point I chose to discard. Vengeance 2007 (June 24, 2007) coincided with the week news broke of the deaths of Chris Benoit and his family. As you can imagine, Google interest in WWE was at a literal all-time high during this period, which obviously isn’t representative of the PPV buy performance of Vengeance 2007.
Predicted buys were calculated by multiplying the PPV’s Google interest by the average buys per Google interest point for its appropriate PPV type (the latter, seen above).
To make a further adjustment, since predicted buys (based on Google interest) were on average 2.83% higher than actual buys from 2006 to February 2014, I adjusted all predicted buys for the Network era by -2.83%.
What we get is a prediction that’s suggestive but not perfect. 71 of the 108 predictions for 2006 to February 2014 PPVs are within +/-15% and 50 of the 108 within +/-10%. The greatest underestimation of actual buys versus adjusted predicted buys by proportion was +47% for Vengeance 2011. The greatest overestimation by proportion was -37% for Vengeance 2006. Most of the large deviations are for B PPVs which had lower numbers of buys while predictions for non-B PPVs were generally more accurate.
I considered other factors like PPV price and the effect of an MMA PPV during the same weekend.
Adjusting for PPV price, at least with my approach, produced less accurate predictions (see the spreadsheet for this study to compare column O’s -0.08% average to column S’s 11.18% average).
The presence of a same-weekend MMA PPV affected WWE PPVs by an average of -4.9%. With 19 samples of actual buys from pre-Network PPVs, I found a correlation of -0.245, or a weak negative relationship on the whole between MMA PPVs and pre-Network WWE PPVs occurring on the same weekend.
(To adjust for that effect for WWE PPVs after the Network launch, predicted WWE PPV buys were adjusted by more or less than -4.9% to the degree to which the coinciding MMA PPV deviated from the average coinciding MMA PPV buys from 2006 to February 2014 [459,158 buys]. Got all that? Good.)

Let’s compare Network PPVs to pre-Network PPVs!
Finally the most interesting part: What does this methodology predict buys would be for individual PPVs in the Network era?
Another factor that might affect this study: it’s plausible Google interest in WWE generally increased after the launch of the WWE Network specifically because of the Network, which would make PPVs after the Network launch appear to have more interest than PPVs before the launch. In other words, it’s plausible Google activity about subjects related to WWE might’ve increased with the launch of the Network since more people might be Googling about WWE specifically because of the Network since it became the primary medium for PPV events, and that increase in interest might not necessarily reflect an increase in PPV buys in the scenario all the 2014 to present PPVs were available solely on traditional pay-per-view. However when we compare Google interest in WWE to that of specifically the WWE Network, we find interest in the WWE Network is small compared to general WWE interest, at about a 1:10 ratio.
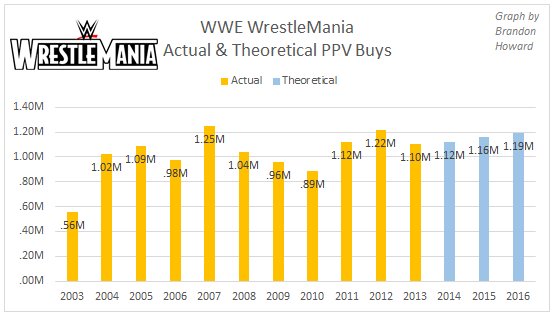
Based on this study, WrestleMania 32 generated interest just below that of the two biggest wrestling PPVs of all-time: WrestleMania 23 in 2007 (featuring Donald Trump and Vince McMahon putting their hair on the line) and WrestleMania 28 in 2012 (main evented by the first Rock vs. John Cena match).
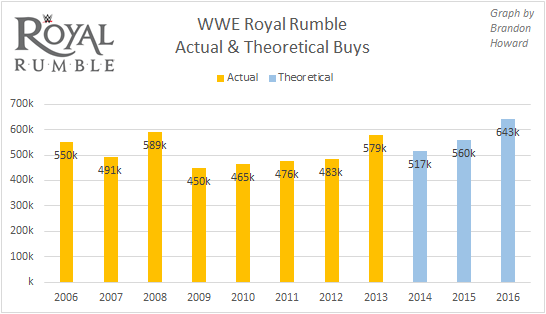
This suggests interest in the Royal Rumble this year was the highest it’s been in many years. We have to go back to Royal Rumble 2002, which did 670,000 buys, to find a Rumble PPV that performed better by this model. Would this year’s Rumble really perform that strongly on PPV? Could rumors about A.J. Styles eventual debut on the show have contributed to the Google interest determining the theoretical buys here? Google interest for Styles was by far at its all-time peak at the same time. Would that interest have translated into actual PPV buys? Interest in Styles looks like it might’ve been enough to push WWE’s interest at the same time up about 10 points. Does any of this mean suspicion that someone is going to debut would equate to PPV buys? It’s hard to say. There’s also the possibility WWE might’ve been more likely choose to advertise Styles’ debut if it wanted to sell PPV buys.
The different approach the company might’ve taken if PPV was its primary distribution medium for its big events is an issue that admittedly pervades this study.
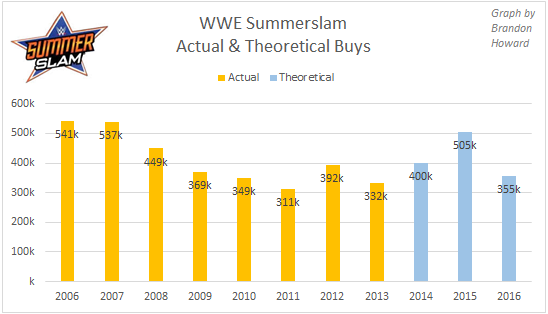
This year’s Summerslam appears up compared to most years, but down from last year’s event which was headlined by Brock Lesnar vs. Undertaker in a rematch from their streak-ending WrestleMania match. 2014’s card was main evented by Brock Lesnar’s memorable destruction of John Cena. This study predicts this year’s Summerslam would’ve been hurt by the UFC 202 PPV that took place the same weekend, which did 1.65 million buys.
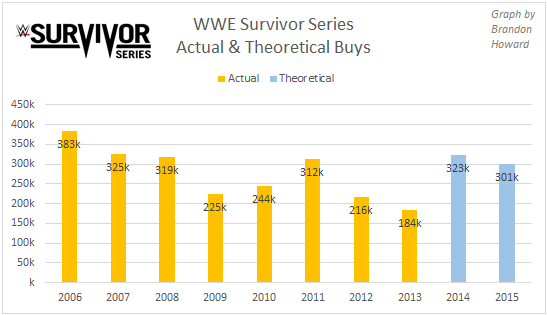
2014’s Survivor Series had strong interest, likely due to the rumored debut of Sting and the heavy stipulation that risked Stephanie McMahon and Triple H’s positions as authority figures. Again, like with Styles’ debut, this leads us to wonder whether buzz about Sting’s debut would actually translate into business as this graph suggests. Last year’s event was headlined by a four-man tournament for the vacant WWE World Heavyweight Title, which was ultimately won by Roman Reigns who was quickly defeated by Sheamus as the latter cashed in his Money in the Bank title shot. This year’s Survivor Series is on November 20.
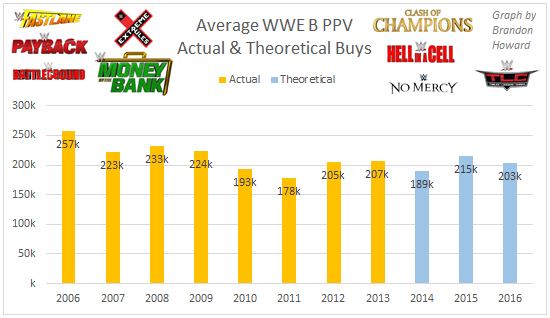
With the addition of more PPVs this year by way of the RAW-SmackDown brand-split, average interest in the B PPVs is holding up in 2016. The average theoretical buys for just for the brand-exclusive B PPVs this year is 203,000, or just above the B PPV average for 2014, and above the actual buys for 2010 and 2011.
We need to check total buys for B PPVs to get an idea of whether the increase in the number of PPVs is actually adding any value to the Network.
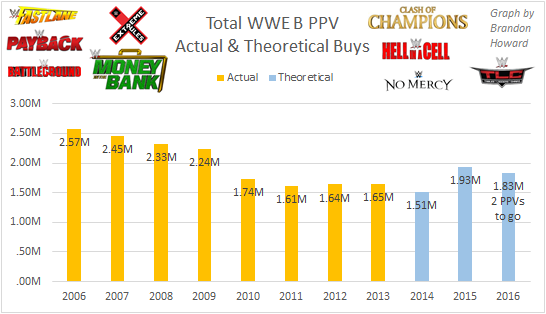
There are two B PPVs to go in 2016, both in December: Tables, Ladders and Chairs; and Roadblock. Total theoretical buys for B PPVs will almost certainly exceed last year’s and end up around 2.2 million: the highest since the actual buys of 2009. Increasing the number of PPVs per year however made more sense when PPVs were sold individually rather than as a part of a monthly subscription.
The data related to this article can be found here. Thanks to Keith Harris and Chris Harrington for their suggestions for improvements to this study.
